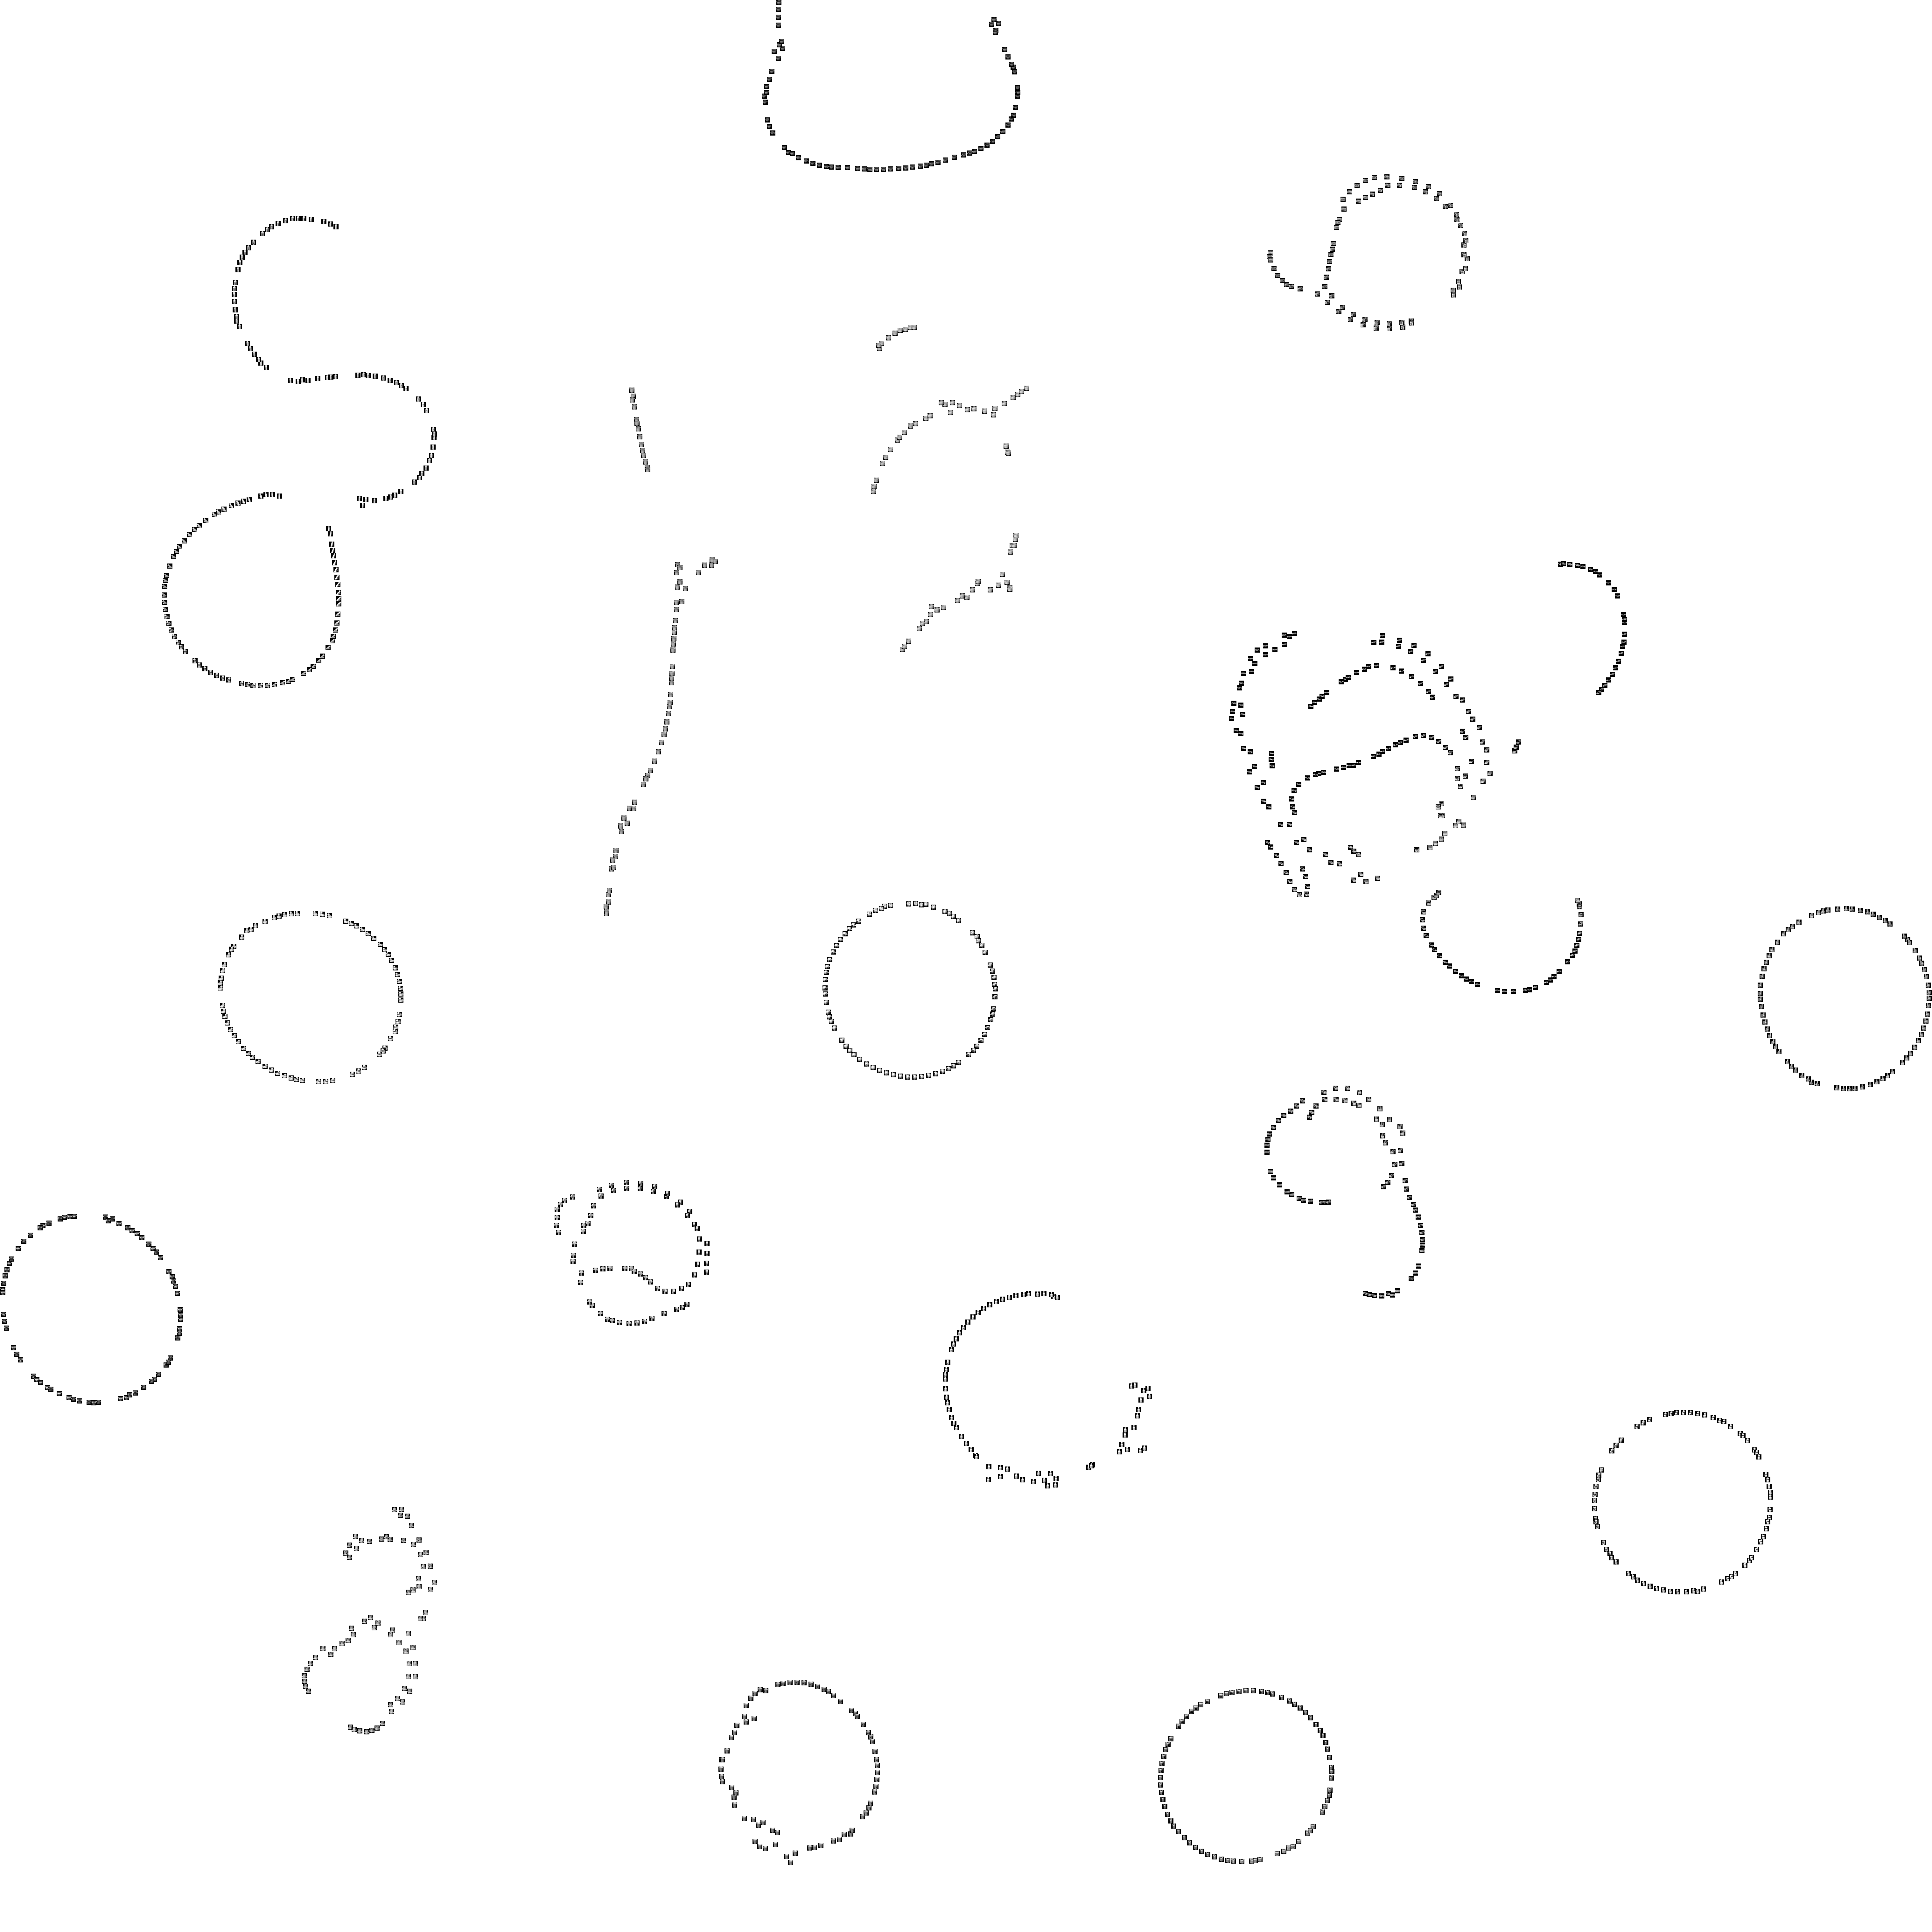
Visualization with toy images (6072×6072, 376K)
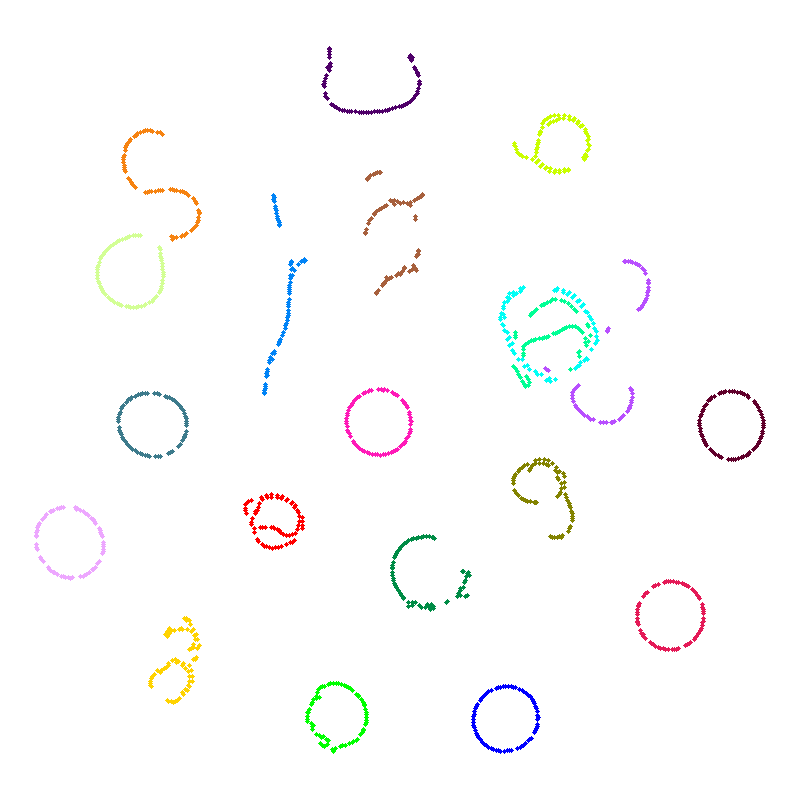
COIL-20 is a data set of 1440 toy images, each of size 128×128, in 20 classes (shown by colors). The visualization was created with the following steps:
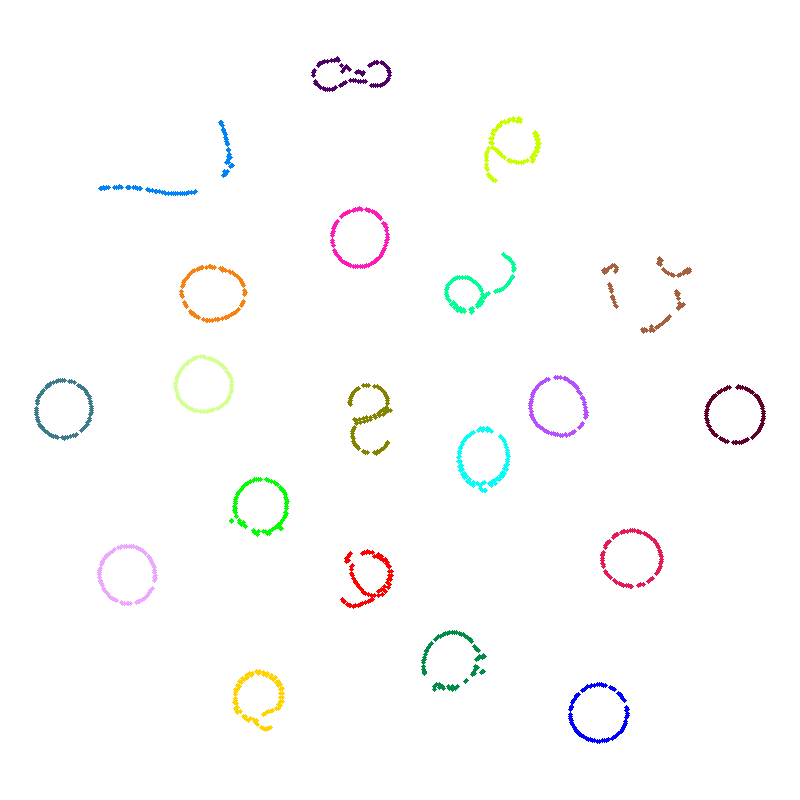
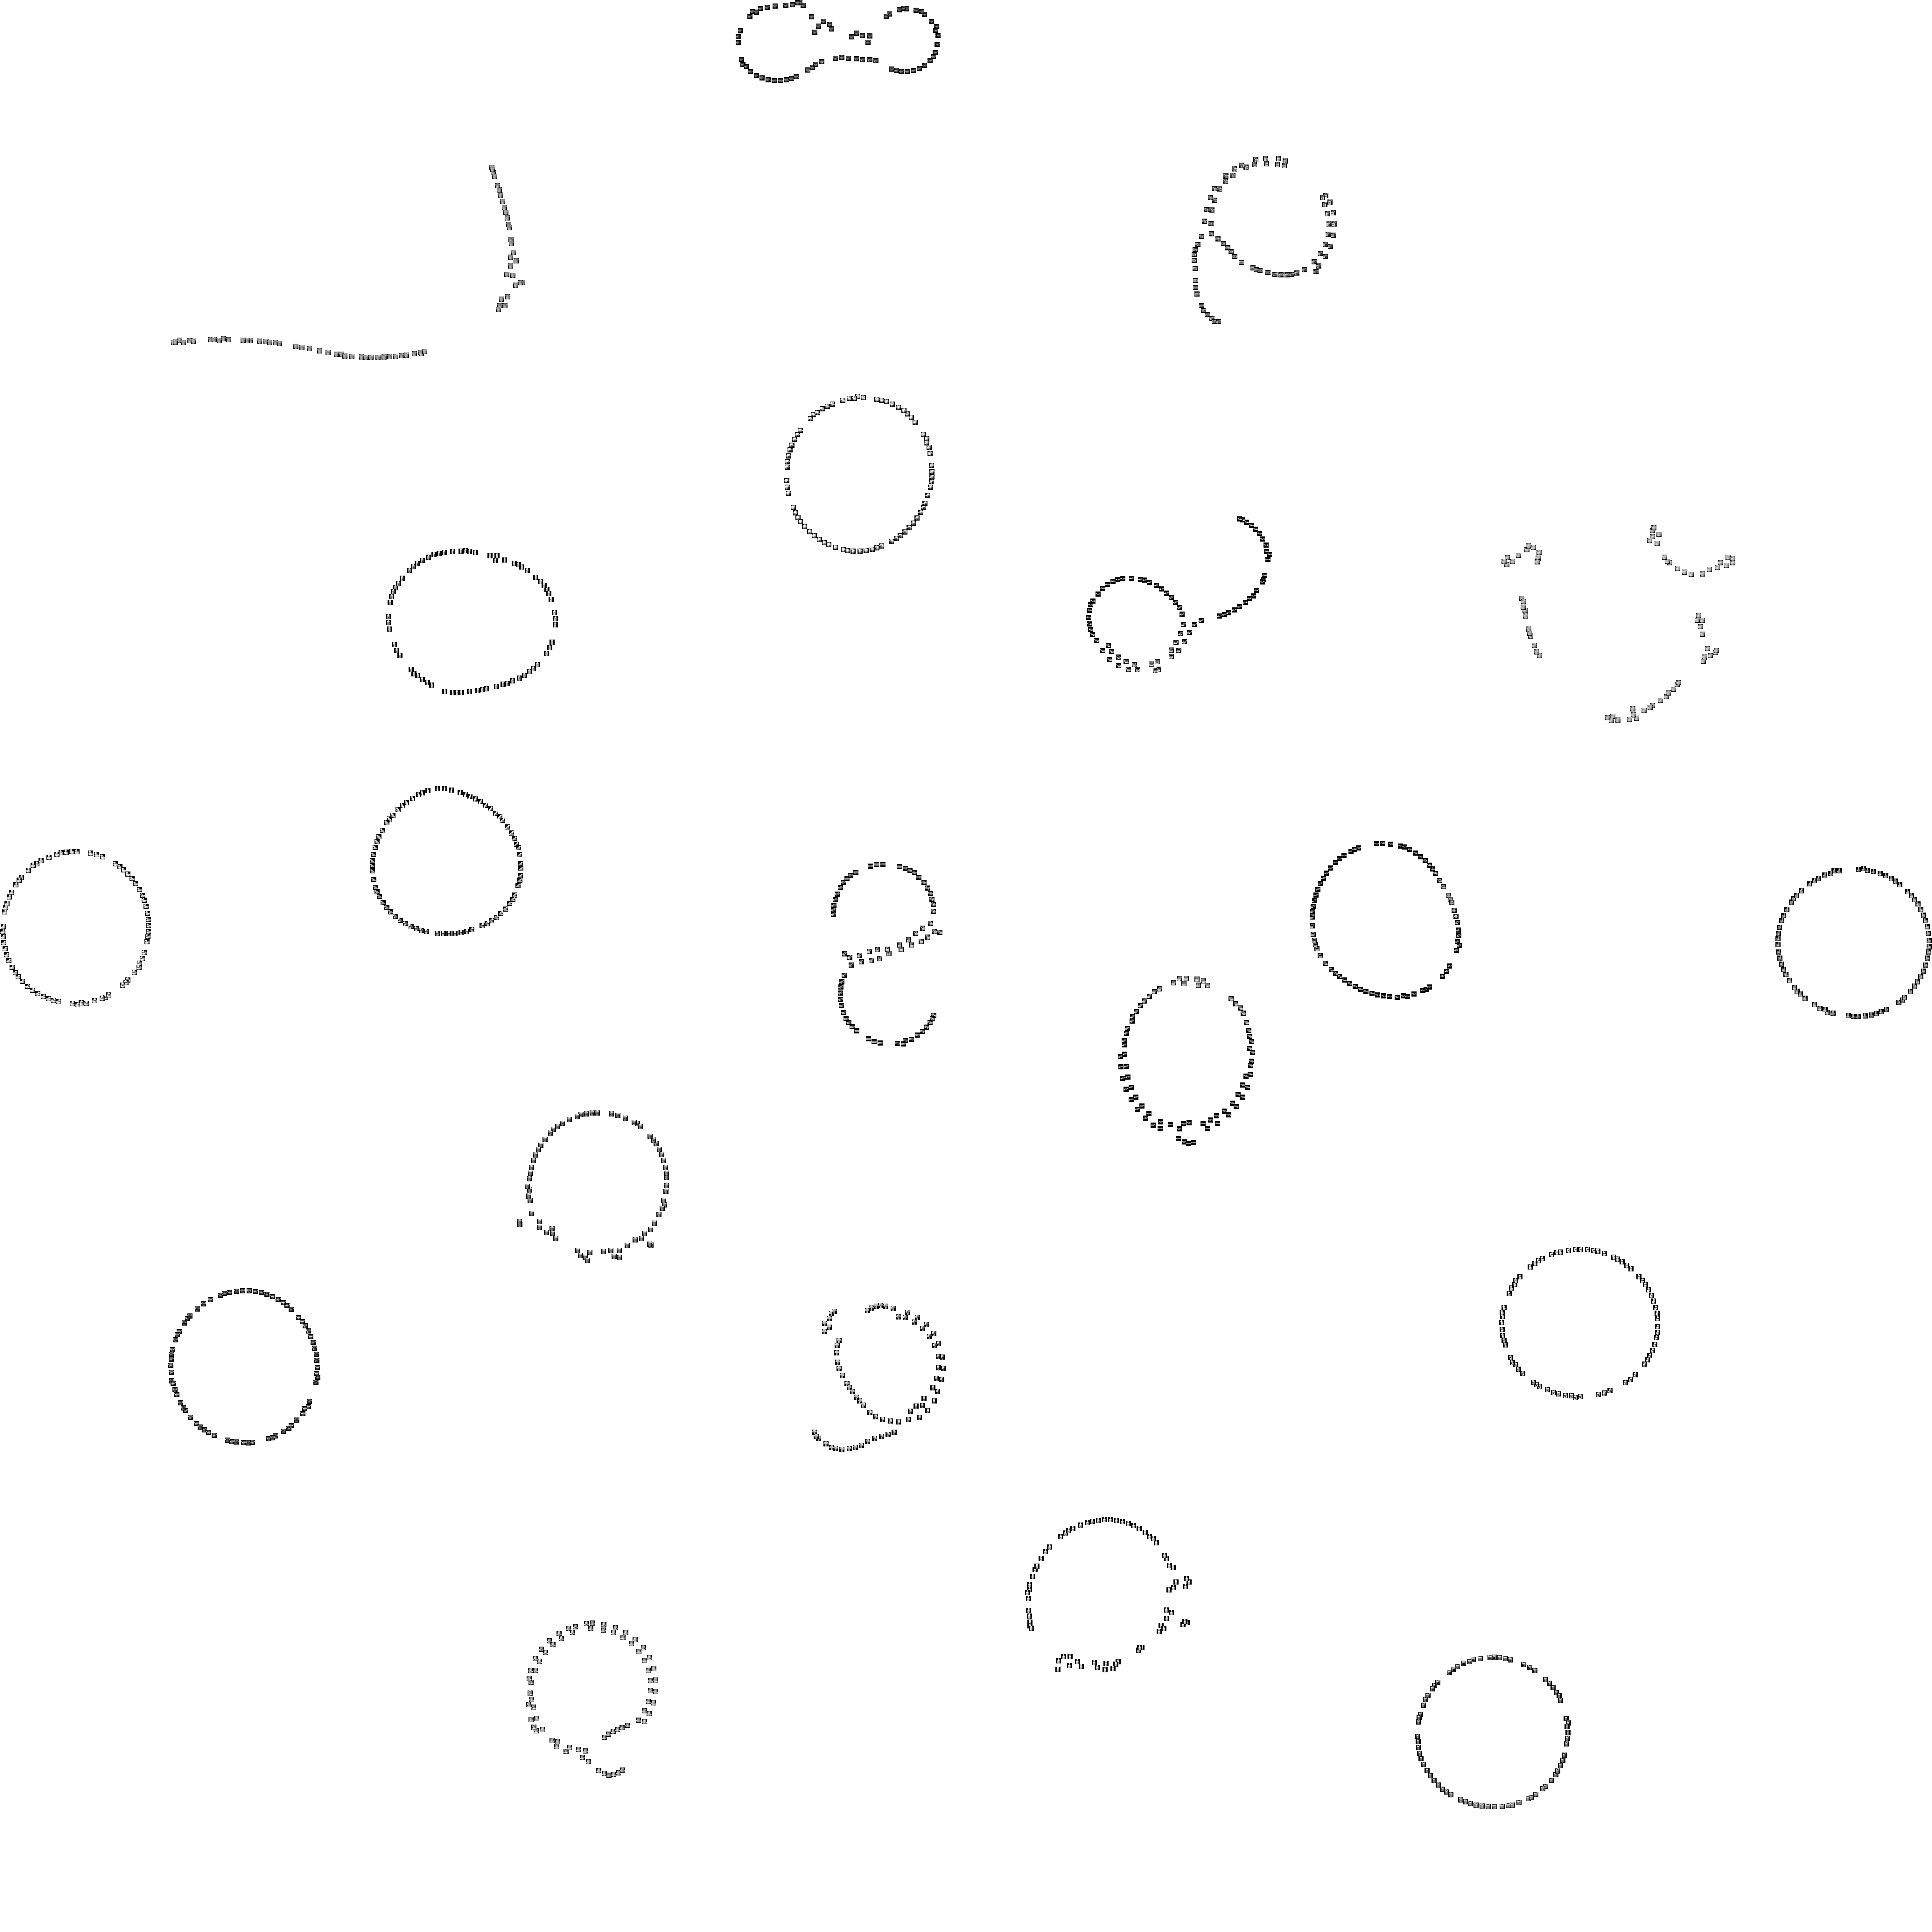
If we use 256 principal components of the scattering features (by Mallat et al.) instead of pixels, we obtain the following visualization:
Visualization with toy images (6072×6072, 369K)
P.S. Simple k-means clustering on the above 2-D coordinates give 100% accuracy.
Matlab command: [idx,centers] = kmeans(Y, 20, 'emptyaction', 'singleton','replicates', 10);
That is, we can perfectly separate the 20 classes in an unsupervised way.