- Details
- Published: 07 May 2013
Introduction
This spring, members of the Virtual Acoustics Team conducted a Media Technology Seminar: Applied Data Analysis and Visualization. The concept of the course was to explore new methods to visualize spatial acoustic room impulse responses. Students from the media technology and computer science departments, some without prior acoustics knowledge, brought diverse skills and expertise to the seminar and produced a variety of animated and interactive graphics to illustrate the high-dimensional data.
The data set is a collection of acoustic room impulse responses that the Virtual Acoustics Team measured during a tour of 10 of Europe's great concert halls, in November of 2012. Measurements were conducted with 36 loudspeakers on the stage of each hall, and for multiple listening positions in the audience areas. The receiver was a 6 microphone array, which allowed post-processing to determine the direction of arrival of the sound at each instant in the impulse response. This processing was conducted prior to handing the data over to the students. Thus, the data were multi-dimensional, at least 8 dimensions could be represented. Students were encouraged to explore visualizing source positions, receiver positions, three-dimensional spatial aspects, temporal development, frequency characteristics, and comparisons between halls.
While students were expected to have basic knowledge of computer graphics, their backgrounds were diverse. Some were members of the Virtual Acoustics Team and were well versed in room acoustics techniques, while others had no previous experience with acoustics, but brought programming, computer graphics, or other expertise to the group. For this reason, students were paired in an attempt to maximize synergies. Specific methods or software were not dictated in order to prevent limiting the possible outcomes.
The first task for each student was to produce a 3D model of one of the concert halls. This exercise allowed the students to become familiar with the spaces the measured data were taken from, and the models provided a context for the data visualizations. The students were encouraged to incorporate the visualizations into the models to provide an environmental context for the data, and this was accomplished with various degrees of success.
The second task was to create an animation or interactive graphic to represent the data. The students produced several novel visualizations, which are displayed here.
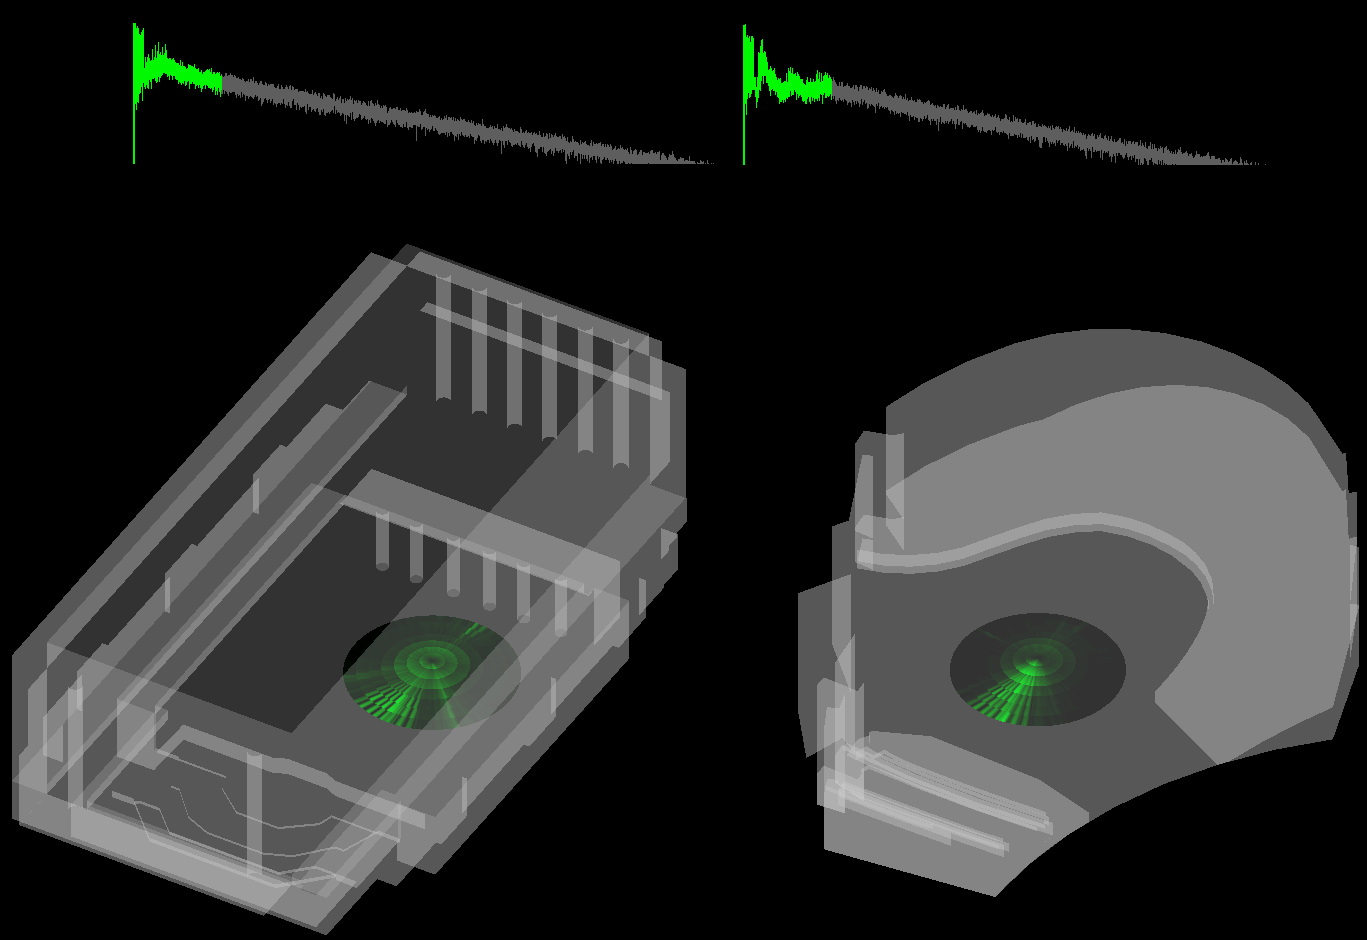
Lateral plane energy distribution in octave bands. Aki Haapaniemi and Petri Leskinen
This visualization demonstrates the lateral energy, integrated over a given time window, and divided into octave bands. It is novel because, while time-frequency plots and, spatial energy plots have been utilized in the past, spatial frequency plots are much less common in room acoustics. The data disk is located within the hall at the receiver position, and the energy from each direction is highlighted in green. Octave bands are illustrated in concentric circles, with the lowest frequencies at the center. Interactive sliders allow the viewer to examine various time windows.
Nested tesselated spheres. Petri Leskinen and Aki Haapaniemi
Similar to the previous one, this visualization places a representation of the sound energy within the concert hall model, at the receiver location. Here, the data are represented in broadband, rather than in octave bands, but several time windows can be nested to examine the early and late sound responses simultaneously. The graphic is interactive to allow the viewer to fly around and zoom the response.
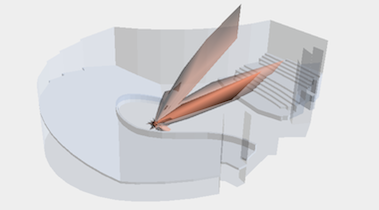
Dynamic sound arrivals. Morley Zan-Bi and Antti Kuusinen
This visualization is based on the open-source package Processing. The concept is to visualize the time and direction of arriving sound with parallelepipeds that converge on the listening position. In this image the sound source is to the right and the listener position is at the center. The direct sound is indicated in red, the early reflections in green, and the late reverberation in blue. The size of each particle and its final distance from the receiver position represent the strength of the reflection at that particular time instant. The visualization is animated to allow the viewer to watch the development of the room response over time, and interactive to allow the user to pan and zoom around the response for a complete view.
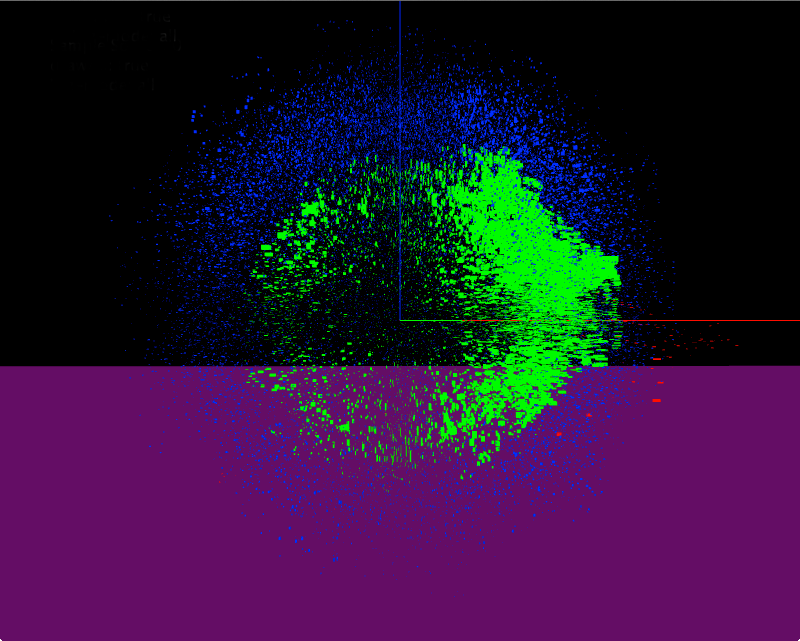
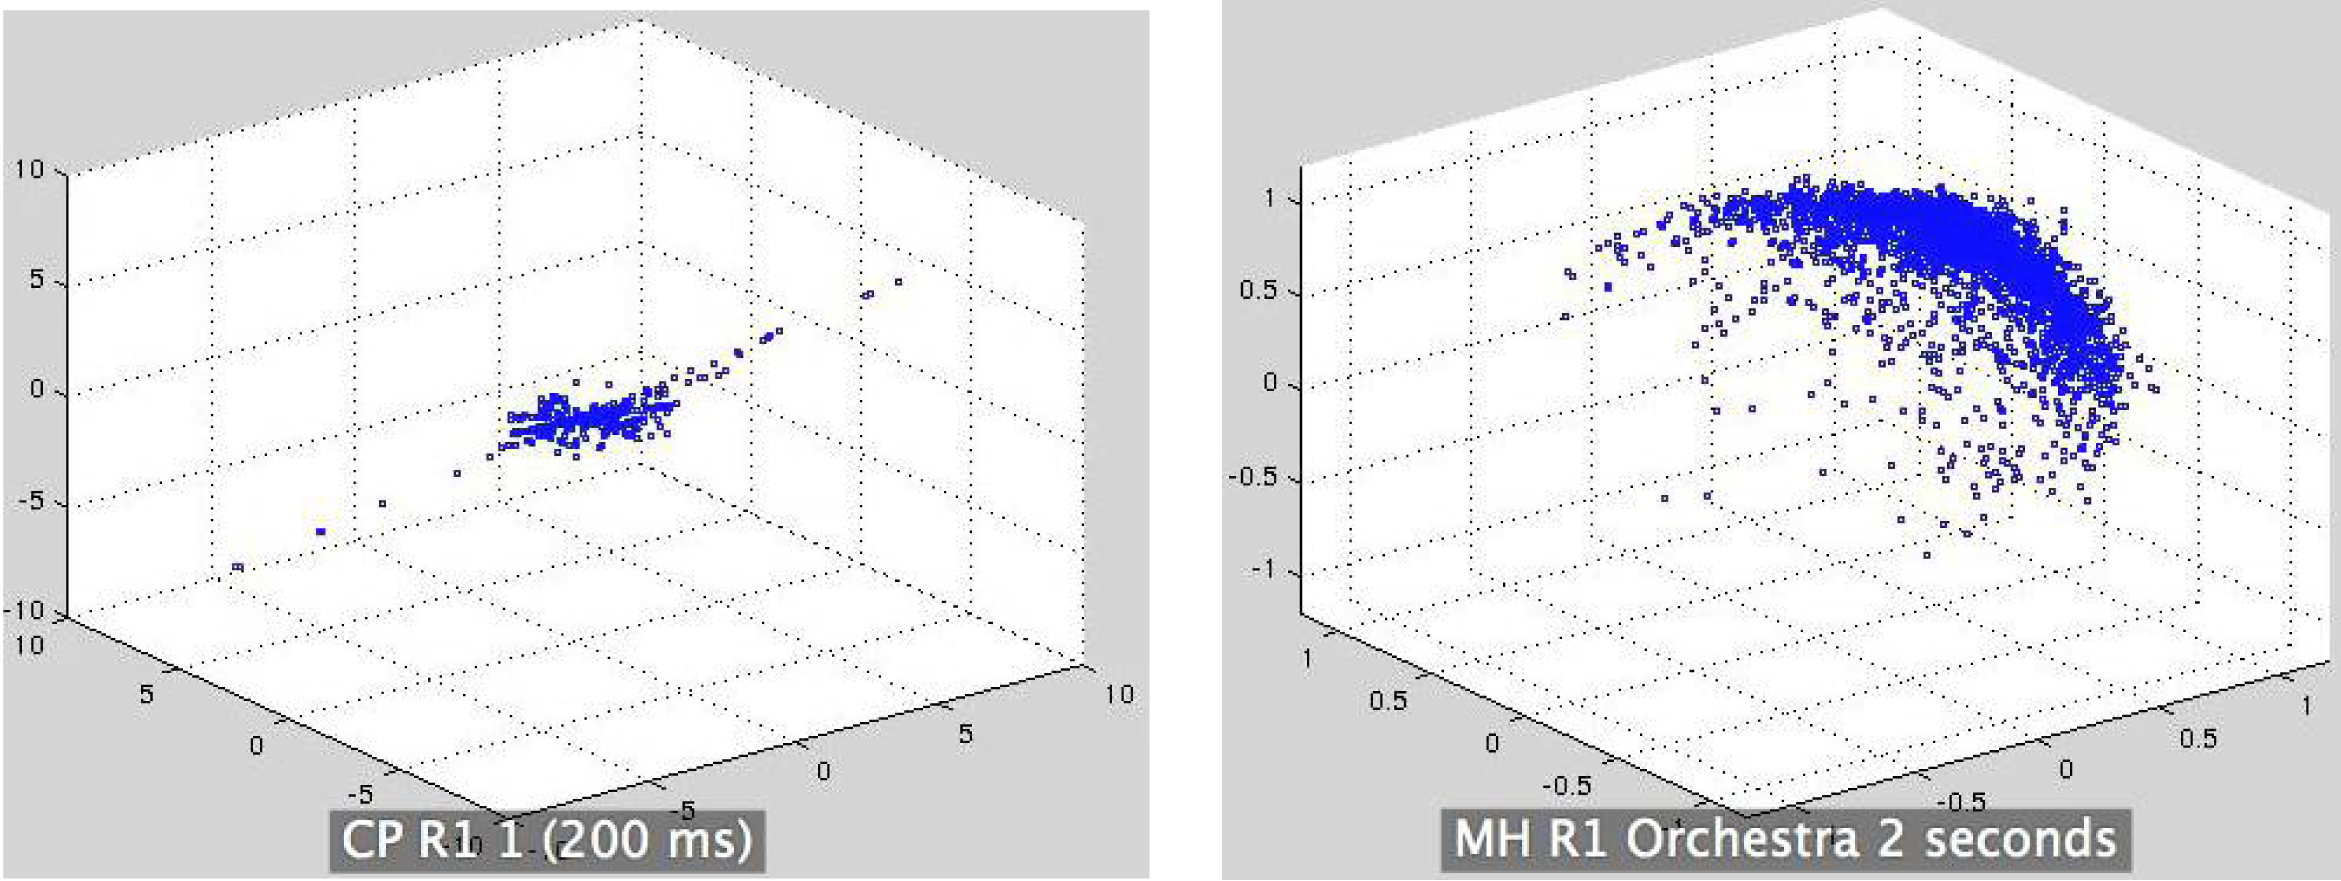
Spherical Energy. Hannu Järvinen and Timo Rutanen
The final visualization takes a similar approach and animates the sound arrival strengths and directions. Frames include approximately 1 ms of data and are overlapped 50%. The particles are positioned at a distance from the receiver proportional to their strength and in the direction of their arrival.
Conclusion
A design studio approach to the data visualization course allowed the students to use their own creativity to illustrate a large database of high dimensional data. The measured concert hall data provided and interesting and challenging context for this exploration. The resulting novel visualization techniques may have further utility for room acoustics research and are a tangible and useful course outcome.