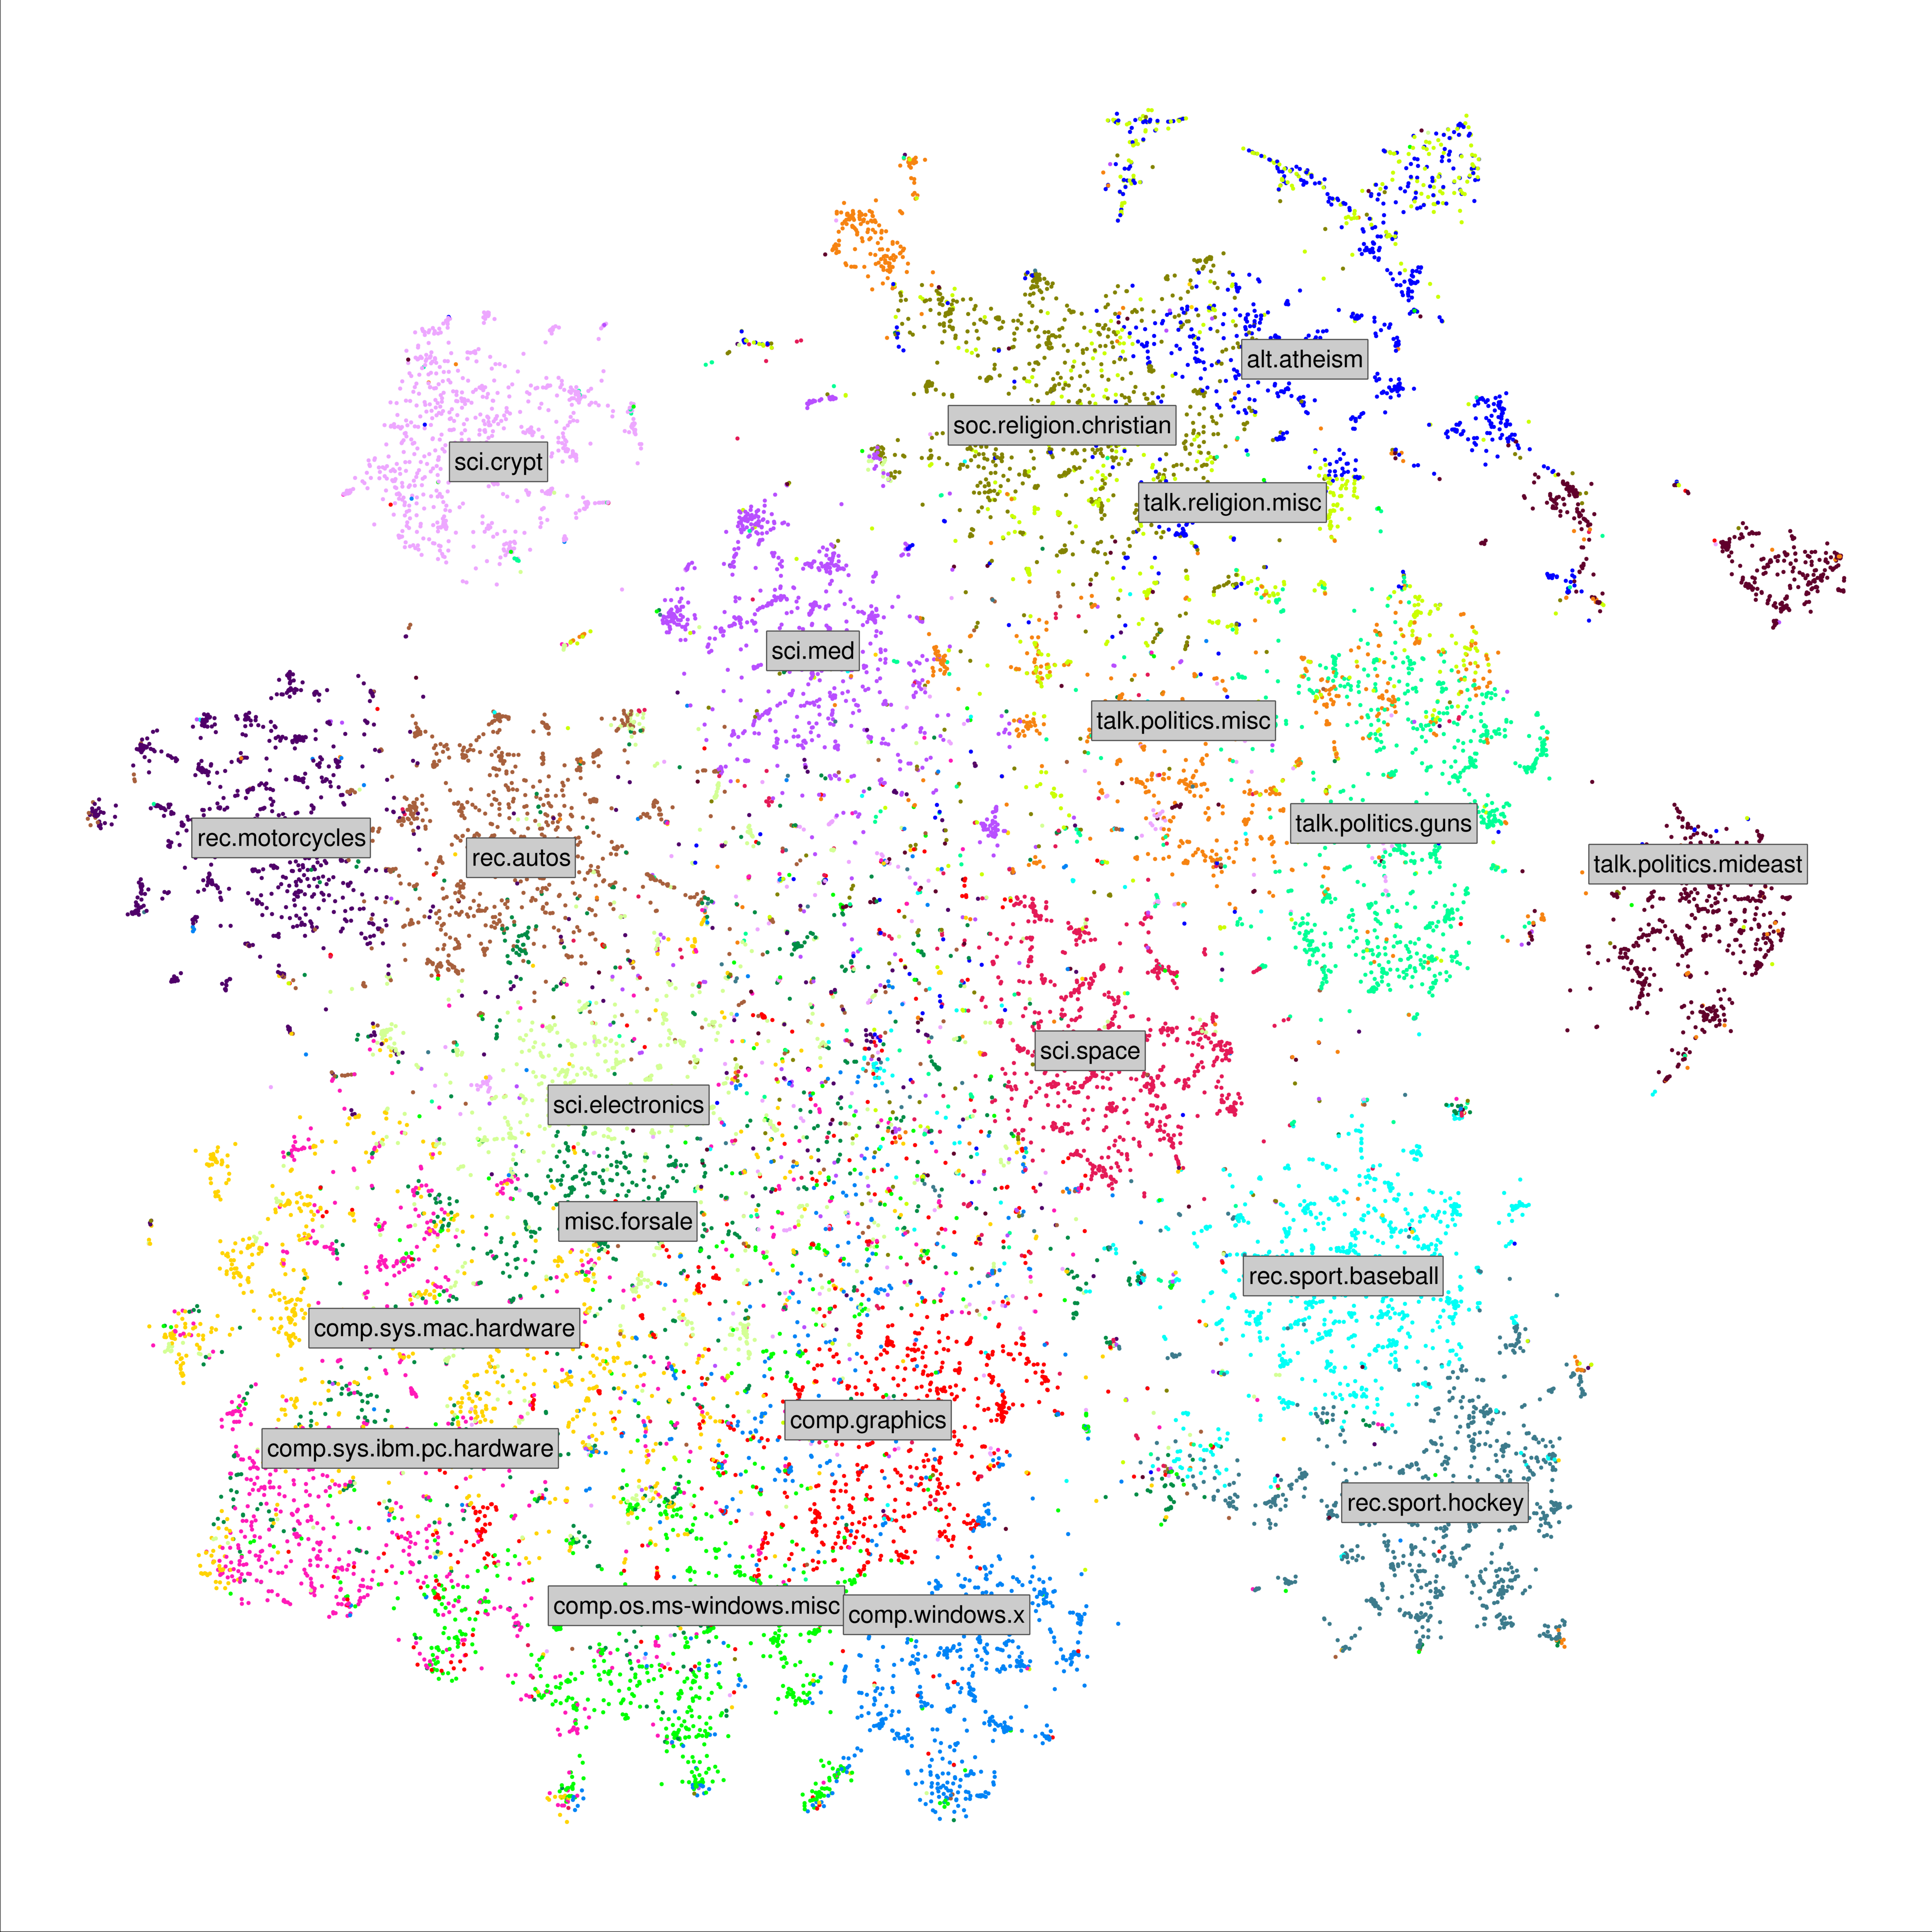
Different resolutions of the visualization are available:
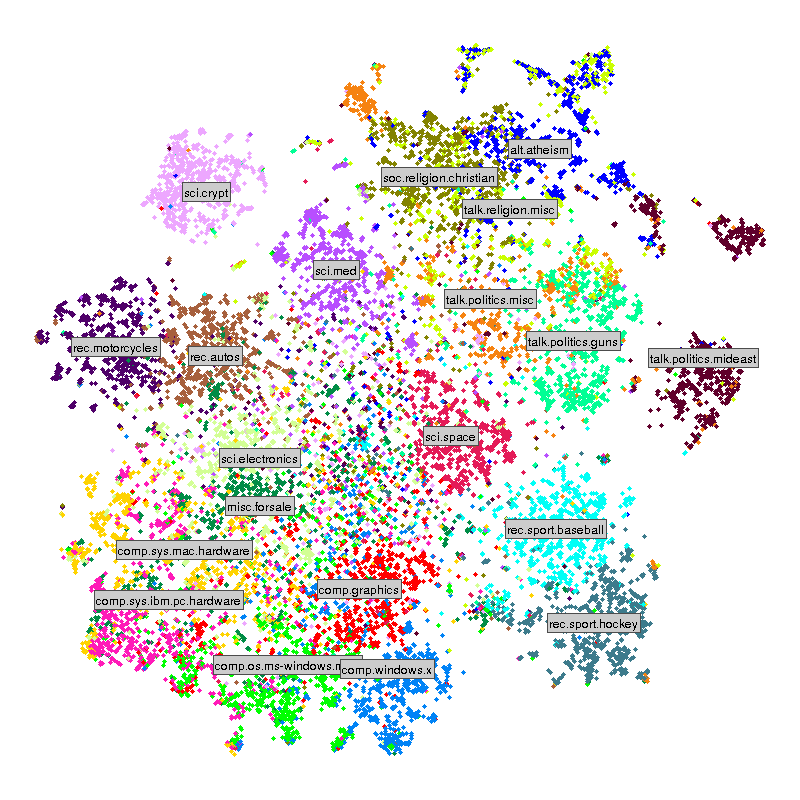
"20 Newsgroups" is a data set of 20000 text documents in 20 classes (shown by colors). The visualization was created with the following steps:
- Get the document-term counts (by the rainbow software)
Suppose the original 20 Newsgroups data is in the folder "20_newsgroups"
rainbow -d model_20newsgroups --skip-header --skip-html --lex-pipe-command "perl tag-digits" --prune-vocab-by-infogain=10000 -i 20_newsgroups
rainbow -d model_20newsgroups --print-matrix=aie > data_20newsgroups_10k.txt
- Compute the TfIdf feature, resulting a 19938x10000 sparse data matrix
- Calculate 30-Nearest-Neighbor graph, using the cosine similarities, i.e. A=cos_knn(X,30).
- Supply A to NE using wtsne_p, with over-attraction initialilzation, i.e. Y=wtsne_p(A, true);
- The class names are placed in the median location of each class in the 2-D space.