Different resolutions of the visualization are available:
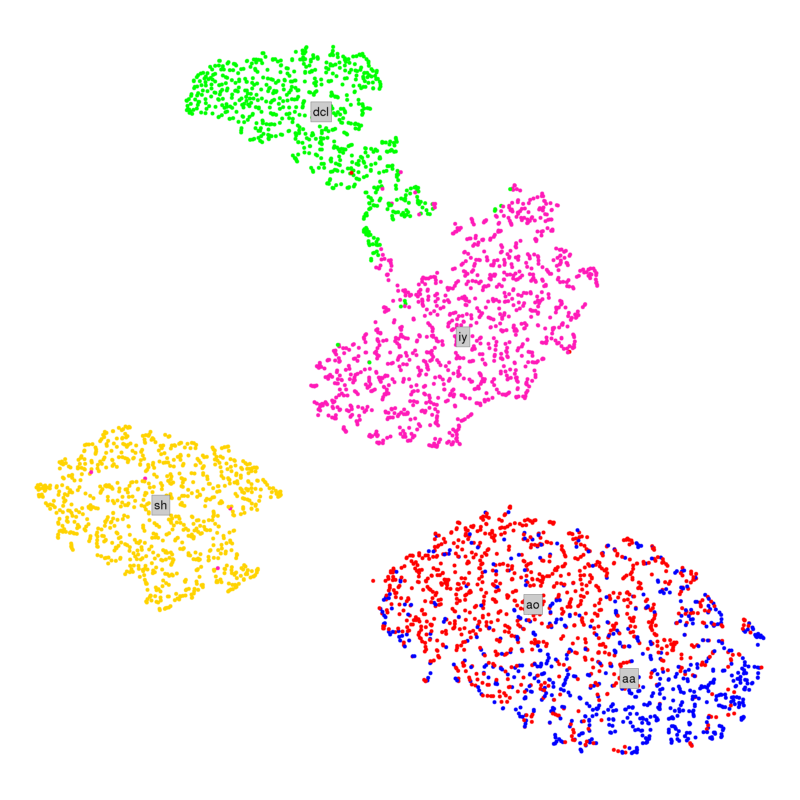
This is a dataset obtained from the textbook "The Elements of Statistical Learning: Data Mining, Inference, and Prediction" by Hastie et al. There are 4508 samples in 5 phonenme classes (shown by colors). The visualization was created with the following steps:
- Load the data. Suppose the data matrix is X, each row for a sample.
- Calculate 5-Nearest-Neighbor graph, using the Euclidean distances, i.e. A=fastknn(X,5);
- Supply A to NE using wtsne_p, with over-attraction initialilzation, i.e. Y=wtsne_p(A, true);
- The class names are placed in the median location of each class in the 2-D space.