
Different resolutions of the visualization are available:
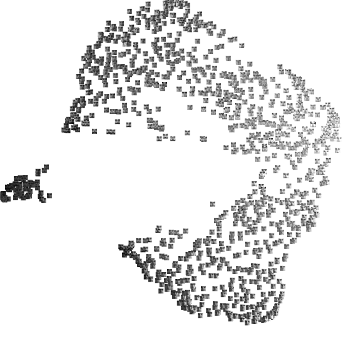
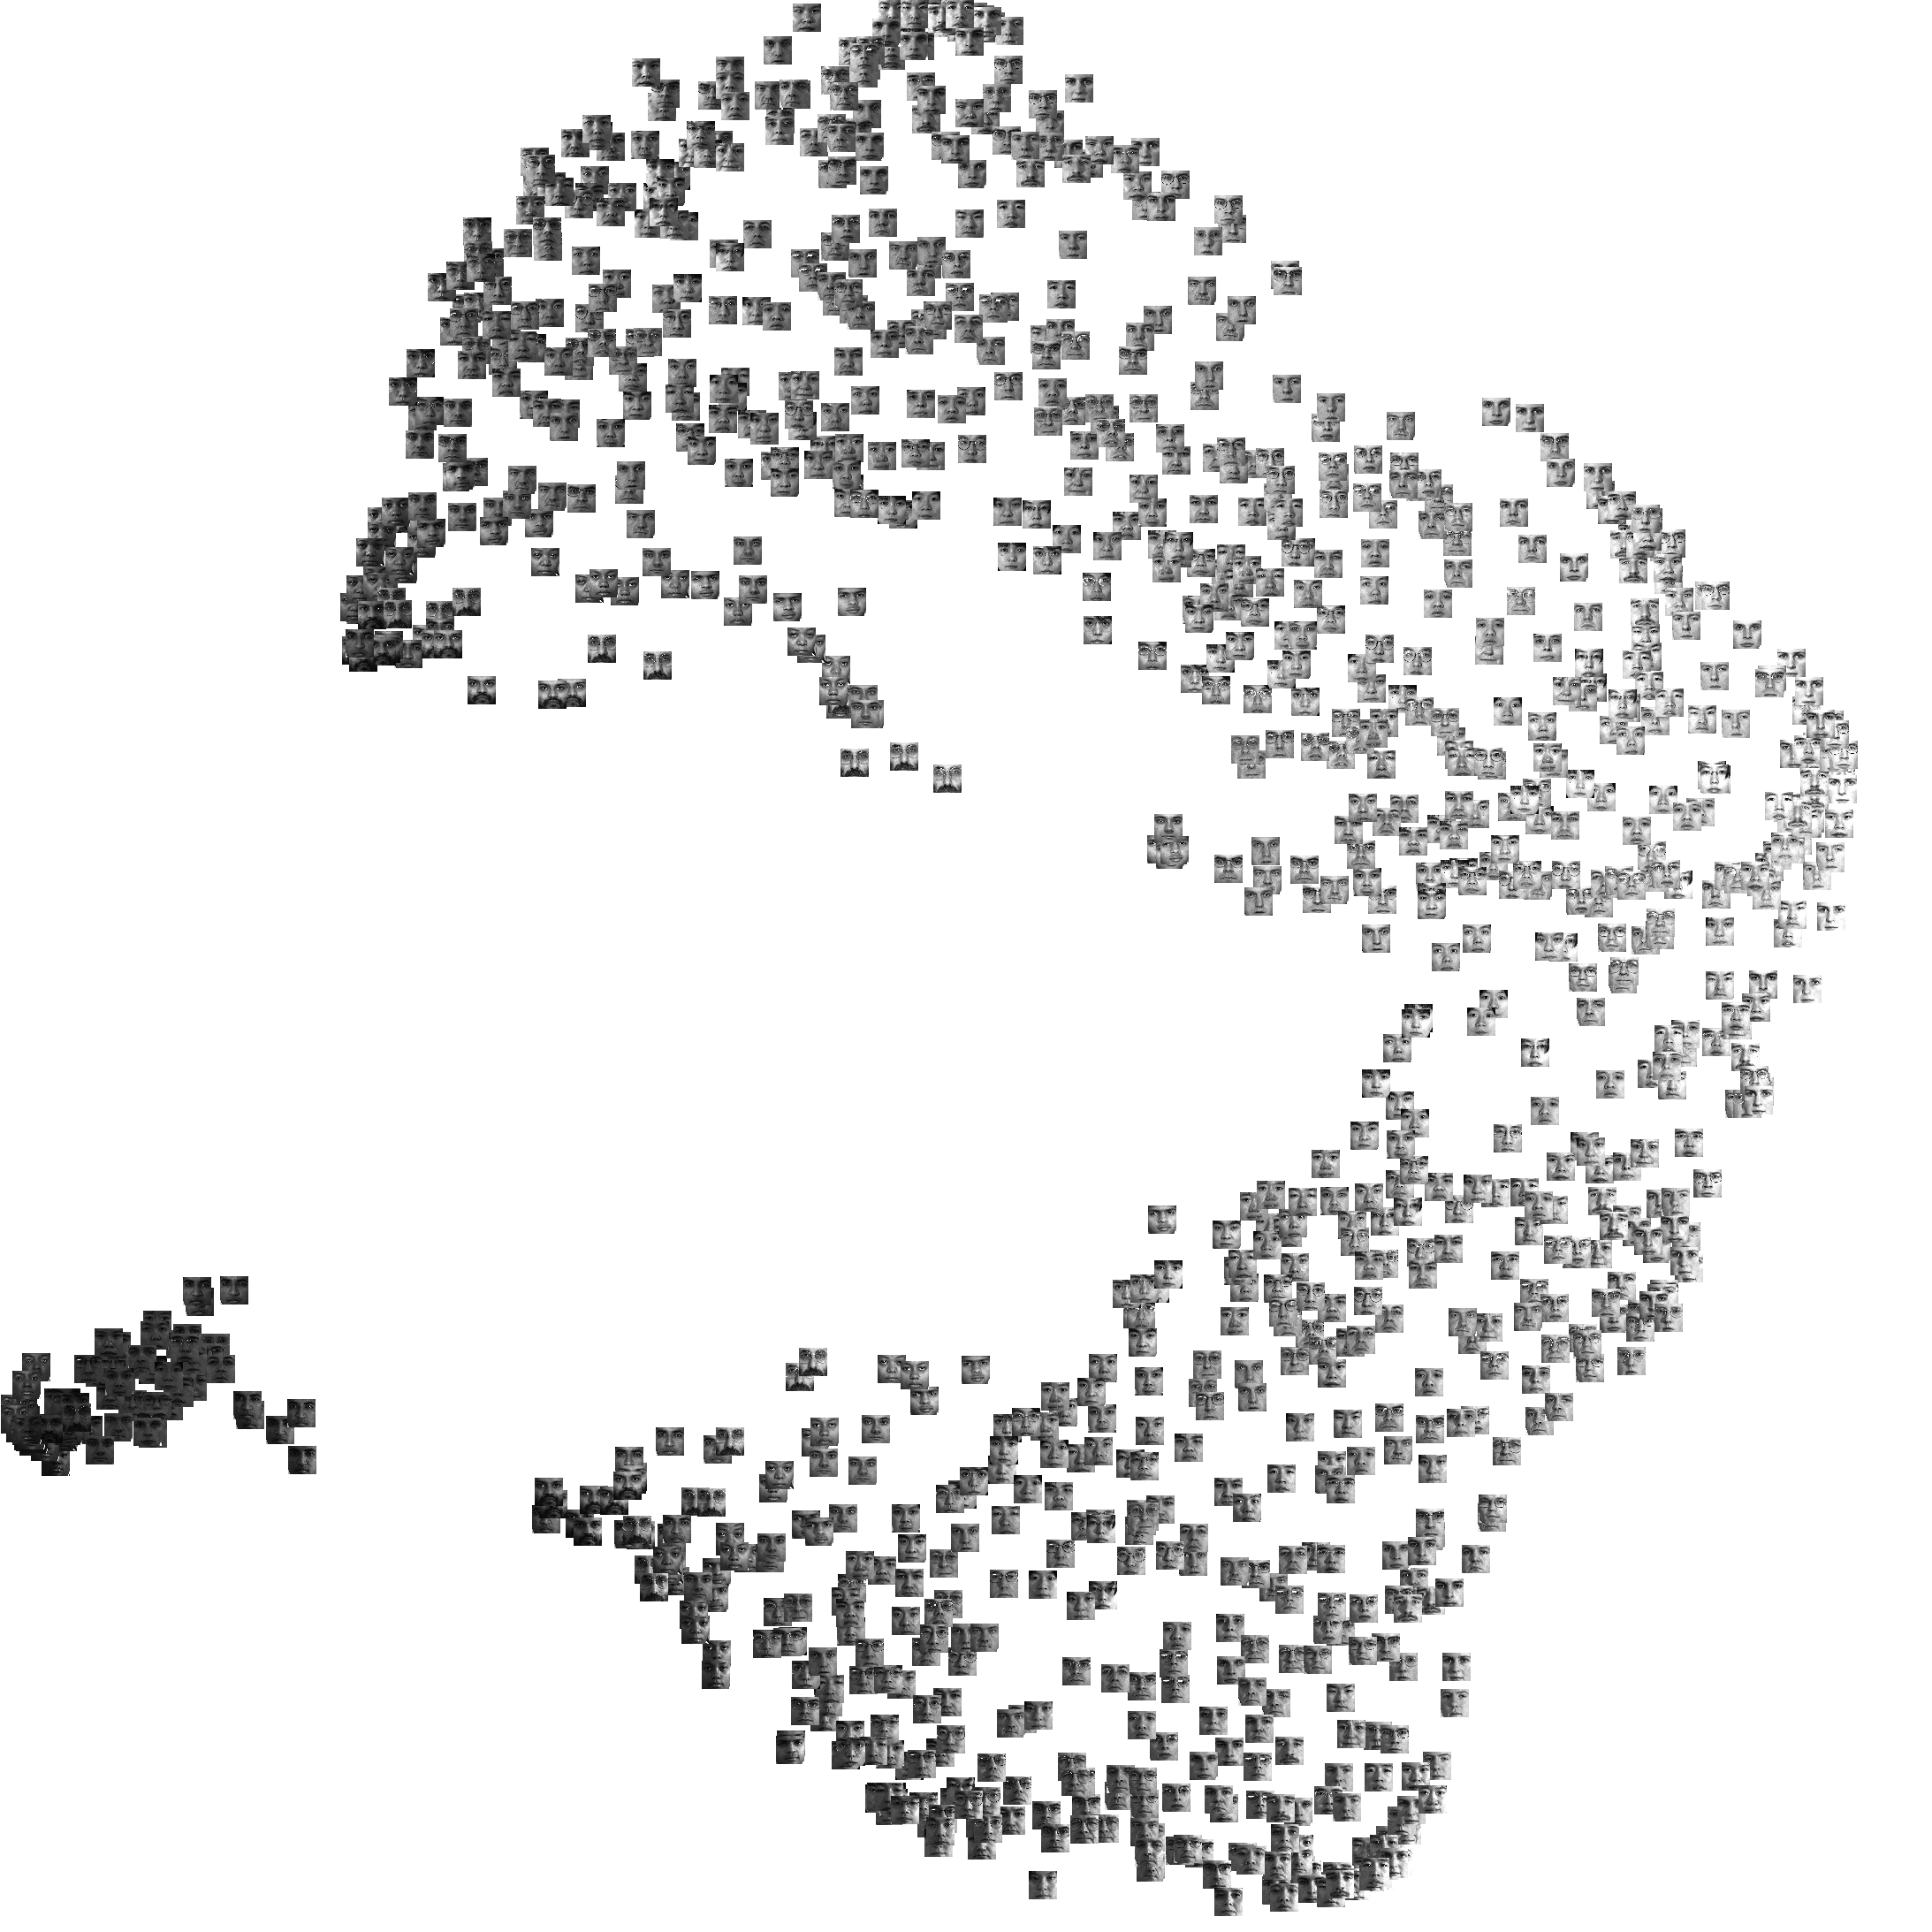
PIE is provided by the face research group at CMU. a data set of 1166 face images, each of size 32×32, taken in different lighting conditions. The visualization was created with the following steps:
- Load the PIE data in raw pixel representation. Suppose the data matrix is X, each row for a face image.
- Calculate 50-Nearest-Neighbor graph, using the Euclidean distances, i.e. A=fastknn(X,50);
- Supply A to NE using wtsne_p, with over-attraction initialilzation, i.e. Y=wtsne_p(A, true);
- Place the images according to Y.