
Probabilistic Machine Learning
GPstuff - log Gaussian Cox process demo
Log Gaussian Cox process for point process intensity estimation
Demonstration of point process intensity estimation using discretized nonhomogenous Poisson process.
1D intensity estimation
The figure below shows the 1D point process intensity estimation of the classical coal mine accident data.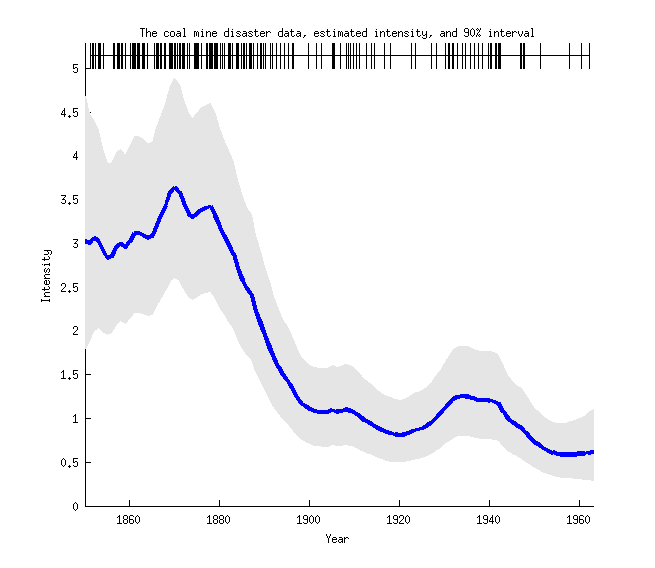
Code for the 1D intensity estimation example
S = which('demo_lgcp');
L = strrep(S,'demo_lgcp.m','demodata/coal.txt');
x=load(L);
lgcp(x,[1850:1963]','gpcf',@gpcf_exp)
line([x x],[5 5.3],'color','k')
line(xlim,[5.15 5.15],'color','k')
xlim([1850 1963])
ylim([0 5.29])
title('The coal mine disaster data, estimated intensity, and 90% interval')
xlabel('Year')
ylabel('Intensity')
2D intensity estimation
The figure below shows the 2D point process intensity estimation of the classical Redwood data.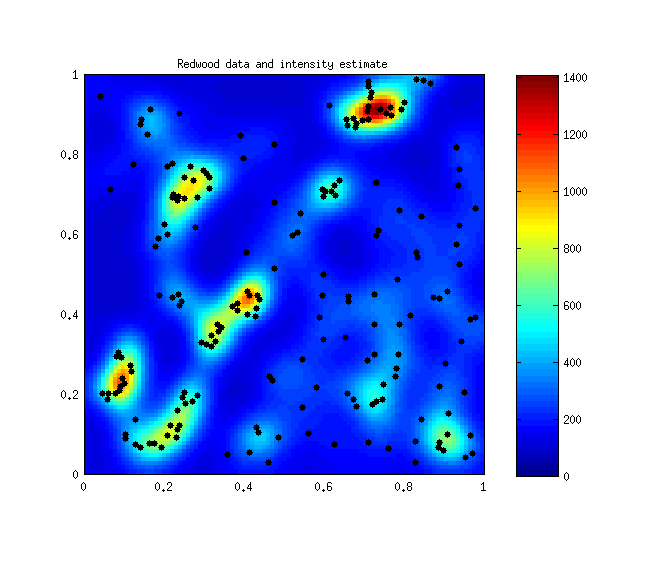
Code for the 2D intensity estimation example
S = which('demo_lgcp');
L = strrep(S,'demo_lgcp.m','demodata/redwoodfull.txt');
x=load(L);
lgcp(x,'range',[0 1 0 1],'latent_method','Laplace','gridn',20)
h=line(x(:,1),x(:,2),'marker','.','linestyle','none','color','k',...
  'markersize',10);
colorbar
axis square
set(gca,'xtick',[0:.2:1],'ytick',[0:.2:1])
title('Redwood data and intensity estimate')